2025年9月5日

パスポート受け取り
訳あって台風の豪雨の中強行軍で、有楽町のパスポートセンターへパスポート受け取りにいってきました。運悪く横殴りの雨になったときに出たので、ズボンがビシャビシャになった。
パスポート電子申請を事前に済ませている場合、印紙を買ってパスポートを受け取るだけでめちゃ早いです。役所は遅くてやたら待たされるのが通常ですが、久しぶりに快適快速に終わりました。マイナンバーカードありがとう、デジタル庁ありがとう。感謝しかない。
コメント一覧
- コメントはありません。
 この記事にコメントする
2025年9月7日
ジャガーXEのタイヤ交換(FALKEN AZENIS)
目次: 車
タイヤのメーカーが左前だけ違うのと、溝の残りが4mmくらいで結構減ってしまっていたので、車を買ったばかりですがタイヤ交換することにしました。タイヤのメーカーが違う理由は、おそらく前のオーナーさんが片方パンクしたのを応急処置的に変えたのだと思われます。
新しいタイヤはレガシィにも付けていたFALKEN AZENIS FK520L(製品サイト)にしました。ミシュランやヨコハマと比べればFALKENはお買い得価格ですが、それでも工賃その他もろもろ込みで19万円くらいになりました。高いよ〜!
理由は明らかで前タイヤは235/35R20、後タイヤは265/30R20でめちゃデカくて扁平だからです。選択肢が少ないし、値段も高いし、タイヤ交換してくれるお店も少ないし、辛さがすごい。これで純正サイズ、外車の維持費が高いといわれる理由がわかりました……。
タイヤ交換の時にFK520L 235/35R20 92YはXL(エクストラロード)規格なので、純正の指定空気圧より空気圧を上げておきました。と言われましたが、純正タイヤのPIRELLI P ZERO 235/35R20 92Yも同じXL規格なので、実は空気圧は指定通りでいいのでは??上げすぎで真ん中ばっかり減ったら嫌だなあ。
不遇のFALKENブランド
住友ゴム工業は日本でDUNLOP、FALKENの両ブランドを展開しています。DUNLOPのほうが名の通りが良いから?なのか、自社ブランドのFALKENブランドはやや雑な扱いを受けているようです。例えば両ブランドの同クラスの製品であるDUNLOP SPORT MAXX RSとAZENIS FK520Lのサイトを見比べると扱いの差がわかると思います。

レスポンシブ&派手なDUNLOP SPORT MAXX RSのカタログページ
素朴なFALKEN AZENIS FK520Lのカタログページ
でもFALKENは名品だと思いますね、ラインナップ広いしコスパは断然良いと思います。
コメント一覧
- コメントはありません。
この記事にコメントする
2025年9月12日
ジャガーさんのパワステから異音
目次: 車
だいたい10km/h前後の低速走行時にハンドルを切ると「グワ、グワワ」みたいな小さいうなり音が聞こえるようになりました。アヒルが住んでいるのか?
今のところ特に動作に支障はありませんが、壊れる前兆なのでしょうか。パワステ壊れたら高そうだ、嫌だなあ。
コメント一覧
- コメントはありません。
この記事にコメントする
2025年9月19日
KernelSharkのビルド方法
目次: Linux
KernelSharkの動きを見るためにビルドしました。ビルドにはlibtraceなんとか系、qt6、GLUTのライブラリ&ヘッダをインストールする必要があります。ライブラリやヘッダが足りなければcmakeが怒ってきます。エラーメッセージと必要パッケージ名の対応がわかりづらいのは世の常です……。
KernelSharkのビルド方法
$ sudo apt-get install -y \
  cmake ninja-build \
  libtraceevent-dev libtracefs-dev libtracecmd-dev \
  libjson-c-dev qt6-base-dev qt6-scxml-dev libglut-dev

$ git clone git://git.kernel.org/pub/scm/utils/trace-cmd/kernel-shark.git
$ cd kernel-shark

$ cmake -B _build -G Ninja
-- The C compiler identification is GNU 14.2.0
-- The CXX compiler identification is GNU 14.2.0
-- Detecting C compiler ABI info
-- Detecting C compiler ABI info - done
...略...

$ ninja -C _build
ninja: Entering directory `_build'
...略...
[110/110] Linking CXX shared library /...s/kernel-shark/lib/plugin-kvm_combo.so
警告がかなり出てますが、ビルドできてそうなので良しとします。バイナリはビルドディレクトリを無視して、ソースコード直下のbin/ディレクトリの下に生成されます。ビルドするとソースコードディレクトリが汚染される謎の作りです。
動作チェック
動作確認します。まずはtrace-cmdで適当にイベントを取得します。特に何も指定しなければtrace.datにイベント情報が書き込まれるはずです。
KernelSharkの動作チェック
$ sudo trace-cmd start -e sched_switch
$ sudo trace-cmd extract

$ bin/kernelshark ./trace.dat
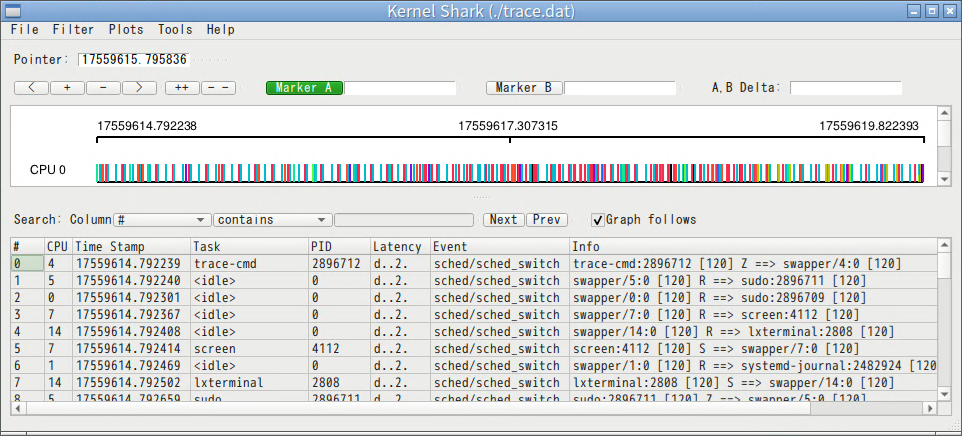
バイナリファイルはbin/kernelsharkです。引数にファイル名を渡して実行するとこんな感じの画面が表示されるはずです。
これでgdbでデバッグしたり、コードを変更してログを入れたりする準備ができました。よかったよかった。
コメント一覧
- コメントはありません。
この記事にコメントする
2025年9月20日
KernelSharkのLatency列
目次: Linux
KernelSharkのイベント情報を見ると「Latency」なる列があって「d..2.」のような謎の表示がなされています。これは一体何なんでしょうか?
KernelSharkのドキュメント(The List View - KernelShark)を見ると、
Latencyの説明(KernelSharkのドキュメントから抜粋)
Latency - The latency is broken into 4 fields:

    Interrupts disabled - 'd' if interrupts are disabled, otherwise '.'
    Need reschedule - 'N' if the kernel was notified that a schedule is needed, otherwise '.'
    In IRQ - 'h' if in a hard IRQ (hardware triggered), 's' if in a soft IRQ (context where the kernel initiated a the IRQ handler) or if soft IRQs are disabled, 'H' if in a hard IRQ and soft IRQs are disabled or the hard IRQ triggered while processing a soft IRQ, otherwise '.'
    Preemption counter - The index of the preemption counter. If it is other than zero, then the kernel will not preempt the running tasks, even if a schedule has been requested by some event. If the counter is zero, then '.' is shown.
だそうです。なるほど4桁分の意味は分かりました。でも5桁目はどういう意味でしょう?昨日構築したKernelSharkのデバッグ環境を使って調べましょう。
どこで表示しているのか?
まずLatencyの表示をどこで作っているのかが全く分からなくて困りました。Qtアプリ全般に言えますが、コールバックが多すぎてまともに追えないです。さらにKernelSharkは独自のModel/Viewアーキテクチャみたいなものまであり地獄の様相です。
まともにコードを読むのは早々に諦めて適当にgrepしたりprintfを追加して、下記の関数がLatencyの文字列を作っているらしいことを突き止めました。
Latencyの文字列を作っている関数
// kernel-shark/src/libkshark-tepdata.c

static char *tepdata_get_latency(struct kshark_data_stream *stream,
				 const struct kshark_entry *entry)
{
	struct tep_record *record;
	char *buffer;

	/* Check if this is a "Missed event" (event_id < 0). */
	if (!init_thread_seq() || entry->event_id < 0)
		return NULL;

	/*
	 * Currently the data reading operations are not thread-safe.
	 * Use a mutex to protect the access.
	 */
	pthread_mutex_lock(&stream->input_mutex);

	record = tracecmd_read_at(kshark_get_tep_input(stream), entry->offset, NULL);

	if (!record) {
		pthread_mutex_unlock(&stream->input_mutex);
		return NULL;
	}

	trace_seq_reset(&seq);
	//★★★★この関数呼び出しで「d..2.」のような文字列を生成している
	tep_print_event(kshark_get_tep(stream), &seq, record,
			"%s", TEP_PRINT_LATENCY);

	tracecmd_free_record(record);

	pthread_mutex_unlock(&stream->input_mutex);

	if (asprintf(&buffer, "%s", seq.buffer)  <= 0)
		return NULL;

	return buffer;
}
tepdata_get_latency()の呼び出し履歴の一例
#0  tepdata_get_latency (stream=0x7fff30000bd0, entry=0x7fff31aec460) at .../kernel-shark/src/libkshark-tepdata.c:35
#1  0x00007ffff7f4fa68 in KsViewModel::getValueStr (this=0x7fffffffc318, column=<optimized out>, row=0) at .../kernel-shark/src/KsModels.cpp:358
#2  0x00007ffff7f4fad1 in KsViewModel::getValue (this=<optimized out>, column=<optimized out>, row=<optimized out>) at .../kernel-shark/src/KsModels.cpp:377
#3  0x00007ffff7f4fb33 in KsViewModel::data (this=<optimized out>, index=<optimized out>, role=<optimized out>) at .../kernel-shark/src/KsModels.cpp:312
#4  0x00007ffff6788e2e in QSortFilterProxyModel::data(QModelIndex const&, int) const () at /lib/x86_64-linux-gnu/libQt6Core.so.6
#5  0x00007ffff7aa9e96 in QItemDelegate::paint(QPainter*, QStyleOptionViewItem const&, QModelIndex const&) const () at /lib/x86_64-linux-gnu/libQt6Widgets.so.6
#6  0x00007ffff7ada750 in ??? () at /lib/x86_64-linux-gnu/libQt6Widgets.so.6
#7  0x00007ffff7adf581 in QTableView::paintEvent(QPaintEvent*) () at /lib/x86_64-linux-gnu/libQt6Widgets.so.6
#8  0x00007ffff78040c5 in QWidget::event(QEvent*) () at /lib/x86_64-linux-gnu/libQt6Widgets.so.6
#9  0x00007ffff789c3e6 in QFrame::event(QEvent*) () at /lib/x86_64-linux-gnu/libQt6Widgets.so.6
#10 0x00007ffff6595eda in QCoreApplicationPrivate::sendThroughObjectEventFilters(QObject*, QEvent*) () at /lib/x86_64-linux-gnu/libQt6Core.so.6
#11 0x00007ffff77b47d5 in QApplicationPrivate::notify_helper(QObject*, QEvent*) () at /lib/x86_64-linux-gnu/libQt6Widgets.so.6
#12 0x00007ffff6596630 in QCoreApplication::notifyInternal2(QObject*, QEvent*) () at /lib/x86_64-linux-gnu/libQt6Core.so.6
#13 0x00007ffff77f3693 in QWidgetPrivate::sendPaintEvent(QRegion const&) () at /lib/x86_64-linux-gnu/libQt6Widgets.so.6
#14 0x00007ffff77f55a3 in QWidgetPrivate::drawWidget(QPaintDevice*, QRegion const&, QPoint const&, QFlags<QWidgetPrivate::DrawWidgetFlag>, QPainter*, QWidgetRepaintManager*) () at /lib/x86_64-linux-gnu/libQt6Widgets.so.6
#15 0x00007ffff7817501 in QWidgetRepaintManager::paintAndFlush() () at /lib/x86_64-linux-gnu/libQt6Widgets.so.6
#16 0x00007ffff7803afd in QWidget::event(QEvent*) () at /lib/x86_64-linux-gnu/libQt6Widgets.so.6
#17 0x00007ffff77b47e5 in QApplicationPrivate::notify_helper(QObject*, QEvent*) () at /lib/x86_64-linux-gnu/libQt6Widgets.so.6
#18 0x00007ffff6596630 in QCoreApplication::notifyInternal2(QObject*, QEvent*) () at /lib/x86_64-linux-gnu/libQt6Core.so.6
#19 0x00007ffff6597197 in QCoreApplicationPrivate::sendPostedEvents(QObject*, int, QThreadData*) () at /lib/x86_64-linux-gnu/libQt6Core.so.6
#20 0x00007ffff67a6db7 in ??? () at /lib/x86_64-linux-gnu/libQt6Core.so.6
#21 0x00007ffff59043c5 in ??? () at /lib/x86_64-linux-gnu/libglib-2.0.so.0
#22 0x00007ffff59065f7 in ??? () at /lib/x86_64-linux-gnu/libglib-2.0.so.0
#23 0x00007ffff5906d60 in g_main_context_iteration () at /lib/x86_64-linux-gnu/libglib-2.0.so.0
#24 0x00007ffff67a4323 in QEventDispatcherGlib::processEvents(QFlags<QEventLoop::ProcessEventsFlag>) () at /lib/x86_64-linux-gnu/libQt6Core.so.6
#25 0x00007ffff6598913 in QEventLoop::exec(QFlags<QEventLoop::ProcessEventsFlag>) () at /lib/x86_64-linux-gnu/libQt6Core.so.6
#26 0x00007ffff659a20a in QCoreApplication::exec() () at /lib/x86_64-linux-gnu/libQt6Core.so.6
#27 0x0000555555556c3a in main (argc=<optimized out>, argv=<optimized out>) at .../kernel-shark/src/kernelshark.cpp:154
呼び出し履歴の#0〜#1の間は呼び出し履歴すら消えていますので補完すると、
getValueStr()からtepdata_get_latency()への呼び出し履歴
getValueStr()
  case TRACE_VIEW_COL_AUX:
    kshark_get_aux_info()
      interface->aux_info() : aux_info = tepdata_get_latency
こんな呼び出し順序になっています。コードをさらっと見た程度ではわかりませんでした。複雑すぎる。
KernelSharkの外に答えはあった
話を戻しましょう。Latencyの文字列を作成しているtepdata_get_latency()が呼んでいるtep_print_event()は、残念なことにKernelSharkの関数ではありません。libtraceevent(libtrace/libtraceevent.git - Library to parse raw trace event formats)で実装されています。
Latencyの5桁目を作るコード
// libtraceevent/src/event-parse.c

/**
 * tep_print_event - Write various event information
 * @tep: a handle to the trace event parser context
 * @s: the trace_seq to write to
 * @record: The record to get the event from
 * @format: a printf format string. Supported event fileds:
 *	TEP_PRINT_PID, "%d" - event PID
 *	TEP_PRINT_CPU, "%d" - event CPU
 *	TEP_PRINT_COMM, "%s" - event command string
 *	TEP_PRINT_NAME, "%s" - event name
 *	TEP_PRINT_LATENCY, "%s" - event latency
 *	TEP_PRINT_TIME, %d - event time stamp. A divisor and precision
 *			can be specified as part of this format string:
 *			"%precision.divisord". Example:
 *			"%3.1000d" - divide the time by 1000 and print the first
 *			3 digits before the dot. Thus, the time stamp
 *			"123456000" will be printed as "123.456"
 *	TEP_PRINT_INFO, "%s" - event information. If any width is specified in
 *			the format string, the event information will be printed
 *			in raw format.
 * Writes the specified event information into @s.
 */
void tep_print_event(struct tep_handle *tep, struct trace_seq *s,
		     struct tep_record *record, const char *fmt, ...)
{
	struct print_event_type type;
	struct tep_event *event;
	char *current;
	char *format;
	char *str;
	int offset;
	va_list args;

	event = tep_find_event_by_record(tep, record);
	if (!event) {
		trace_seq_printf(s, "[UNKNOWN EVENT]");
		return;
	}

	str = current = format = strdup(fmt);
	if (!format)
		return;

	va_start(args, fmt);
	while (*current) {
		current = strchr(str, '%');
		if (!current) {
			trace_seq_puts(s, str);
			break;
		}
		memset(&type, 0, sizeof(type));
		offset = tep_print_event_param_type(current, &type);
		*current = '\0';
		trace_seq_puts(s, str);
		current += offset;
		switch (type.type) {
		case EVENT_TYPE_STRING:
			//★★★★"%s"を渡している、つまり文字列型なのでこちら
			print_string(tep, s, record, event,
				     va_arg(args, char*), &type);
			break;
		case EVENT_TYPE_INT:
			print_int(tep, s, record, event,
				  va_arg(args, int), &type);
			break;
		case EVENT_TYPE_UNKNOWN:
		default:
			trace_seq_printf(s, "[UNKNOWN TYPE]");
			break;
		}
		str = current;

	}
	va_end(args);
	free(format);
}

static void print_string(struct tep_handle *tep, struct trace_seq *s,
			 struct tep_record *record, struct tep_event *event,
			 const char *arg, struct print_event_type *type)
{
	const char *comm;
	int pid;

	if (strncmp(arg, TEP_PRINT_LATENCY, strlen(TEP_PRINT_LATENCY)) == 0) {
		//★★★★TEP_PRINT_LATENCYを渡しているのでこちら
		data_latency_format(tep, s, type->format, record);
	} else if (strncmp(arg, TEP_PRINT_COMM, strlen(TEP_PRINT_COMM)) == 0) {
		pid = parse_common_pid(tep, record->data);
		comm = find_cmdline(tep, pid);
		trace_seq_printf(s, type->format, comm);
	} else if (strncmp(arg, TEP_PRINT_INFO_RAW, strlen(TEP_PRINT_INFO_RAW)) == 0) {
		print_event_info(s, type->format, true, event, record);
	} else if (strncmp(arg, TEP_PRINT_INFO, strlen(TEP_PRINT_INFO)) == 0) {
		print_event_info(s, type->format, false, event, record);
	} else if  (strncmp(arg, TEP_PRINT_NAME, strlen(TEP_PRINT_NAME)) == 0) {
		trace_seq_printf(s, type->format, event->name);
	} else {
		trace_seq_printf(s, "[UNKNOWN TEP TYPE %s]", arg);
	}

}

/*
 * This parses out the Latency format (interrupts disabled,
 * need rescheduling, in hard/soft interrupt, preempt count
 * and lock depth) and places it into the trace_seq.
 */
static void data_latency_format(struct tep_handle *tep, struct trace_seq *s,
				char *format, struct tep_record *record)
{
	static int check_lock_depth = 1;
	static int check_migrate_disable = 1;
	static int lock_depth_exists;
	static int migrate_disable_exists;
	unsigned int lat_flags;
	struct trace_seq sq;
	unsigned int pc;
	int lock_depth = 0;
	int migrate_disable = 0;
	int hardirq;
	int softirq;
	void *data = record->data;

	trace_seq_init(&sq);
	lat_flags = parse_common_flags(tep, data);
	pc = parse_common_pc(tep, data);
	/* lock_depth may not always exist */
	if (lock_depth_exists)
		lock_depth = parse_common_lock_depth(tep, data);
	else if (check_lock_depth) {
		lock_depth = parse_common_lock_depth(tep, data);
		if (lock_depth < 0)
			check_lock_depth = 0;
		else
			lock_depth_exists = 1;
	}

	/* migrate_disable may not always exist */
	if (migrate_disable_exists)
		migrate_disable = parse_common_migrate_disable(tep, data);
	else if (check_migrate_disable) {
		migrate_disable = parse_common_migrate_disable(tep, data);
		if (migrate_disable < 0)
			check_migrate_disable = 0;
		else
			migrate_disable_exists = 1;
	}

	hardirq = lat_flags & TRACE_FLAG_HARDIRQ;
	softirq = lat_flags & TRACE_FLAG_SOFTIRQ;

	//★★★★1〜3桁目
	trace_seq_printf(&sq, "%c%c%c",
	       (lat_flags & TRACE_FLAG_IRQS_OFF) ? 'd' : '.',
	       (lat_flags & TRACE_FLAG_NEED_RESCHED) ?
	       'N' : (lat_flags &  TRACE_FLAG_NEED_RESCHED_LAZY) ? 'L' :'.',
	       (hardirq && softirq) ? 'H' :
	       hardirq ? 'h' : softirq ? 's' : '.');

	//★★★★4桁目
	if (pc & 0xf)
		trace_seq_printf(&sq, "%x", pc & 0xf);
	else
		trace_seq_printf(&sq, ".");

	//★★★★5桁目
	if (pc & 0xf0)
		trace_seq_printf(&sq, "%x", pc >> 4);
	else
		trace_seq_printf(&sq, ".");

	if (migrate_disable_exists) {
		if (migrate_disable < 0)
			trace_seq_printf(&sq, ".");
		else
			trace_seq_printf(&sq, "%d", migrate_disable);
	}

	if (lock_depth_exists) {
		if (lock_depth < 0)
			trace_seq_printf(&sq, ".");
		else
			trace_seq_printf(&sq, "%d", lock_depth);
	}

	if (sq.state == TRACE_SEQ__MEM_ALLOC_FAILED) {
		s->state = TRACE_SEQ__MEM_ALLOC_FAILED;
		return;
	}

	trace_seq_terminate(&sq);
	trace_seq_puts(s, sq.buffer);
	trace_seq_destroy(&sq);
	trace_seq_terminate(s);
}
やっと発見できました。pc(Preemption Counter)の上位4ビットでした。何を意味する値なのでしょう?また今度調べましょう。
コメント一覧
- コメントはありません。
この記事にコメントする
2025年9月22日
初の中国出張
機会があって中国、北京に出張で行きました。中国に行くのは初めてです。まあそもそも仕事でも私用でも海外に行くことはほとんどないですけど。今回の出張はホテル、チケット、食事の場所まで手配してもらえてめちゃ楽でした。しかも羽田空港を発着する航空便で、移動すら楽でした。最高です。
東京、7年前に出張で行ったインドのハイデラバードと比べて、いろいろ考えてしまいました。
北京
- 活気: 謎の祭りをやっていたりネオンがビカビカしていて活気がありました。
- 街中: かなりキレイです。全体的に砂っぽいのは仕方ない?
- 道路: 整備されていて広く、6車線、8車線道路もざらです。
- 交通: 市外ナンバーを市内に入れない制限があるそうで車も渋滞も少ないです。
- 空: 市街地中央部に高架道路がほぼなくて空が開けています。
- 運転: 荒いです、なぜか速度違反はあまり見かけませんでした。
- その他: 監視カメラが死ぬほどあります。走っているとフラッシュが光って写真を撮られます、動画カメラもいたるところにあります。
ハイデラバード
- 活気: 人がめちゃくちゃ多いし元気な印象でした。
- 街中: キレイとは言い難いです、道路や歩道に変な穴が開いていてゴミが落ちています。
- 道路: 広い道もありますが、未整備だったりごちゃごちゃです。
- 交通: 激しく渋滞しています。
- 空: 市街地中央部に高架道路はほぼないですが、ビルと道がやや近いです。
- 運転: 荒いです、クラクションを挨拶か何かだと思っています。
- その他: 野犬がその辺をうろうろしています、狂犬病が怖い。
東京
- 活気: 活気は微妙ですね、渋谷とかは活気があるのか……?
- 街中: キレイです。
- 道路: 整備されていますが、道が細すぎます。
- 交通: 激しく渋滞しています。
- 空: 高架道路だらけ、ビルと道が近くて、空が見えません。
- 運転: 荒くはないものの、スピード違反が異常に多いです。
- その他: 狭すぎる、人が多すぎる。
東京は狭い&ゴチャゴチャ&人多すぎで、外に広げようとしたところで土地がなくて詰んでます。中国やインドの平野の広さは羨ましい限りでした。
コメント一覧
- コメントはありません。
この記事にコメントする
2025年9月24日
初の中国出張の終わり
出張から帰ってきました。北京と東京で感じた違いについては出発のほうに書いてしまったので、ご飯や雑多な話でも。
行き帰りともにAir Chinaの航空便でしたが、機内食がおいしかったです。また北京の料理店のご飯もとてもおいしかったです。私は辛い料理が苦手ですが、北京では辛い料理はメインではないのもGoodなポイント。四川料理はめちゃ辛いらしいので、行っても食べるものがなさそう。
空港
中国に入国するときは、係官の前にある端末で顔写真と指紋を登録します。端末の案内音声が日本語だったのがびっくりでした。日本人用のシステムなのか……??写真で紹介したいのは山々ですが、出入国審査する場所は写真撮影禁止(たぶんどの国でも同じだと思う)です。
日本に入国するときは、税関に行く前にVisit Japan Web(Visit Japan Web - デジタル庁ウェブサービスアプリケーション)で登録しておくと、二次元バーコードをスキャンするだけで税関を通過できて便利です。私は紙の申請書を書いている途中で存在を知ったので、紙とWeb登録を両方やってしまいました。まあいいか。
羽田空港の税関には動植物検疫探知犬(ビーグル、ラブラドールレトリーバー)がいました。農林水産省が写真で紹介しています(動植物検疫探知犬について : 動物検疫所)が、目の前で一生懸命働いているところを見るとめちゃかわいかったです。撮影禁止エリアなのが惜しいなあ……!!
コメント一覧
- コメントはありません。
この記事にコメントする
2025年9月27日
KernelSharkのLatency列の5桁目
目次: Linux
前回(2025年9月20日の日記参照)はKernelSharkのLatency列の意味と文字列を作成しているコードを調べました。その際に5桁目はpc(Preemption Counter)の上位4ビットであることはわかりましたが、この値は何を意味するのでしょうか?
LinuxカーネルにてTRACE_FLAGを使用して値を作成している個所は下記の関数のみです。
TRACE_FLAGを使って値を作成している個所
// linux/kernel/trace/trace.c

unsigned int tracing_gen_ctx_irq_test(unsigned int irqs_status)
{
	unsigned int trace_flags = irqs_status;
	unsigned int pc;

	pc = preempt_count();

	if (pc & NMI_MASK)
		trace_flags |= TRACE_FLAG_NMI;
	if (pc & HARDIRQ_MASK)
		trace_flags |= TRACE_FLAG_HARDIRQ;
	if (in_serving_softirq())
		trace_flags |= TRACE_FLAG_SOFTIRQ;
	if (softirq_count() >> (SOFTIRQ_SHIFT + 1))
		trace_flags |= TRACE_FLAG_BH_OFF;

	if (tif_need_resched())
		trace_flags |= TRACE_FLAG_NEED_RESCHED;
	if (test_preempt_need_resched())
		trace_flags |= TRACE_FLAG_PREEMPT_RESCHED;
	if (IS_ENABLED(CONFIG_ARCH_HAS_PREEMPT_LAZY) && tif_test_bit(TIF_NEED_RESCHED_LAZY))
		trace_flags |= TRACE_FLAG_NEED_RESCHED_LAZY;
	return (trace_flags << 16) | (min_t(unsigned int, pc & 0xff, 0xf)) |
		(min_t(unsigned int, migration_disable_value(), 0xf)) << 4;
}
最後の行が答えで、pc(Preemption Counter)の上位4ビットはmigration_disable_value()の値でした。migrate_disable()を呼ぶたびに増えていく数値です。Preemption Counterと概念は似てますね。
生成された値の行方
このtracing_gen_ctx_irq_test()が生成した値をtrace_ctxと呼ぶとします。
trace_ctxの生成と消費の例(sched_switchイベント)
__schedule()
  trace_sched_switch() : include/trace/events/sched.hのTRACE_EVENT(sched_switch, ...)にて定義&実装
    __traceiter_sched_switch()
      trace_event_raw_event_sched_switch()
        trace_event_buffer_reserve()
          //★★trace_ctx生成
          tracing_gen_ctx_dec()
            tracing_gen_ctx()
              tracing_gen_ctx_irq_test()
          //★★trace_ctxを渡す
          trace_event_buffer_lock_reserve()
            __trace_buffer_lock_reserve()
              trace_event_setup()
                tracing_generic_entry_update()
タスクスイッチイベント(sched_switchイベント)を例にtrace_ctxの行方を示すと、上記のような呼び出し経路です。
trace_ctxをtrace_entryに格納
// linux/include/linux/trace_events.h

static inline void tracing_generic_entry_update(struct trace_entry *entry,
						unsigned short type,
						unsigned int trace_ctx)
{
	entry->preempt_count		= trace_ctx & 0xff;
	entry->pid			= current->pid;
	entry->type			= type;
	entry->flags =			trace_ctx >> 16;
}
渡されたtrace_ctxが上位16ビットと下位8ビットに分けられて、trace_entryに格納されることがわかりました。trace_entryの行方は追っていないですけど、リングバッファに格納されるんでしょう。おそらく。
コメント一覧
- コメントはありません。
この記事にコメントする
2025年9月29日
Debian TestingでX.orgが起動しなくなった、2回目
目次: Linux
Debian TestingなデスクトップPCをapt-get upgradeしたら、またxrdpが動かなくなりました。以前(2024年12月2日の日記参照)と同じ原因のようです。ログファイル~/.xorgxrdp.10.logを見るとX.orgがクラッシュしています。
Xorgがクラッシュしたログ
[  2251.652] (EE) Backtrace:
[  2251.653] (EE) unw_get_proc_name failed: no unwind info found [-10]
[  2251.653] (EE) 0: /usr/lib/xorg/Xorg (?+0x0) [0x56196ae0bf6d]
[  2251.654] (EE) unw_get_proc_name failed: no unwind info found [-10]
[  2251.654] (EE) 1: /lib/x86_64-linux-gnu/libc.so.6 (?+0x0) [0x7f62f1534df0]
[  2251.654] (EE) 2: /lib/x86_64-linux-gnu/libc.so.6 (__pthread_kill_implementation+0x10c) [0x7f62f158995c]
[  2251.654] (EE) 3: /lib/x86_64-linux-gnu/libc.so.6 (__GI_raise+0x12) [0x7f62f1534cc2]
[  2251.655] (EE) 4: /lib/x86_64-linux-gnu/libc.so.6 (__GI_abort+0x22) [0x7f62f151d4ac]
[  2251.655] (EE) 5: /lib/x86_64-linux-gnu/libc.so.6 (__libc_message_impl.cold+0x5) [0x7f62f151e291]
[  2251.655] (EE) 6: /lib/x86_64-linux-gnu/libc.so.6 (malloc_printerr+0x15) [0x7f62f1593465]
[  2251.656] (EE) 7: /lib/x86_64-linux-gnu/libc.so.6 (munmap_chunk+0x7c) [0x7f62f15936ec]
[  2251.656] (EE) 8: /lib/x86_64-linux-gnu/libc.so.6 (__free+0x158) [0x7f62f1598398]
[  2251.656] (EE) 9: /lib/x86_64-linux-gnu/libdrm.so.2 (drmFreeDevice+0x7d) [0x7f62f1a2a13d]
[  2251.657] (EE) 10: /lib/x86_64-linux-gnu/libdrm.so.2 (drmFreeDevices+0x2e) [0x7f62f1a2a2ae]
[  2251.657] (EE) unw_get_proc_name failed: no unwind info found [-10]
[  2251.657] (EE) 11: /lib/x86_64-linux-gnu/libnvidia-egl-gbm.so.1 (?+0x0) [0x7f62f0968f38]
[  2251.657] (EE) unw_get_proc_name failed: no unwind info found [-10]
[  2251.657] (EE) 12: /lib/x86_64-linux-gnu/libEGL_nvidia.so.0 (?+0x0) [0x7f62f06adcb0]
[  2251.657] (EE) unw_get_proc_name failed: no unwind info found [-10]
[  2251.657] (EE) 13: /lib/x86_64-linux-gnu/libEGL_nvidia.so.0 (?+0x0) [0x7f62f064cd9c]
[  2251.657] (EE) unw_get_proc_name failed: no unwind info found [-10]
[  2251.658] (EE) 14: /lib/x86_64-linux-gnu/libEGL.so.1 (?+0x0) [0x7f62f0a5aad5]
[  2251.658] (EE) unw_get_proc_name failed: no unwind info found [-10]
[  2251.658] (EE) 15: /usr/lib/x86_64-linux-gnu/dri/swrast_dri.so (?+0x0) [0x7f62f0a9d3f3]
[  2251.658] (EE) unw_get_proc_name failed: no unwind info found [-10]
[  2251.658] (EE) 16: /usr/lib/xorg/modules/extensions/libglx.so (?+0x0) [0x7f62f11cdc73]
[  2251.658] (EE) unw_get_proc_name failed: no unwind info found [-10]
[  2251.658] (EE) 17: /usr/lib/xorg/modules/extensions/libglx.so (?+0x0) [0x7f62f11ccadf]
[  2251.658] (EE) 18: /usr/lib/xorg/Xorg (_CallCallbacks+0x3c) [0x56196ac941cc]
[  2251.658] (EE) unw_get_proc_name failed: no unwind info found [-10]
[  2251.658] (EE) 19: /usr/lib/xorg/Xorg (?+0x0) [0x56196adc64ef]
[  2251.659] (EE) 20: /usr/lib/xorg/Xorg (InitExtensions+0x89) [0x56196ad01d29]
[  2251.659] (EE) unw_get_proc_name failed: no unwind info found [-10]
[  2251.659] (EE) 21: /usr/lib/xorg/Xorg (?+0x0) [0x56196ac92ae8]
[  2251.659] (EE) 22: /lib/x86_64-linux-gnu/libc.so.6 (__libc_start_call_main+0x78) [0x7f62f151eca8]
[  2251.659] (EE) 23: /lib/x86_64-linux-gnu/libc.so.6 (__libc_start_main_alias_2+0x85) [0x7f62f151ed65]
[  2251.659] (EE) 24: /usr/lib/xorg/Xorg (_start+0x21) [0x56196ac7b641]
[  2251.659] (EE)
[  2251.659] (EE)
Fatal server error:
[  2251.659] (EE) Caught signal 6 (Aborted). Server aborting
libEGL_nvidia.so.0をリネーム
# mv /lib/x86_64-linux-gnu/libEGL_nvidia.so.0 /lib/x86_64-linux-gnu/libEGL_nvidia.so.01
クラッシュしている個所は前回と若干違います。Xorgは起動処理らしき関数(InitExtensions)を呼んでいて、libEGL_nvidia.so.0は終了処理らしき関数(drmFreeDevice)を呼んでいます。おそらく何かエラーが起きていると思いますが、NVIDIAのライブラリはバイナリしか提供されていないので調査不能です。前回同様にlibEGL_nvidia.soをリネームor削除すれば起動します。
NVIDIAドライバを復活させる
前回と同じ直し方で直します。カーネルが入れ替わっているので、古いカーネルヘッダ(linux-headers-6.11.10-amd64)を削除して新しいカーネルヘッダ(linux-headers-6.16.8+deb14-amd64)をインストールします。
次にsudo dpkg-reconfigure nvidia-kernel-dkmsを実行するとNVIDIA系の*.koファイルがビルドされるので、modprobe nvidia-drmでロードします。もしカーネルヘッダの選択を間違っていたら、modprobe時にエラーになるのでわかるはずです。
NVIDIAのドライバはカーネルが変わるたびに毎回ビルドしなおさなければいけないんでしょうか?面倒だな〜。
コメント一覧
- hdkさん(2025/10/02 06:51)
あれ、dkmsは自動ビルドされるのが便利なのに。と思ったらひょっとしてlinux-headers-amd64みたいなの入れ忘れていませんか?
$ dpkg -l|grep linux-'[^-]*'-amd64
ii linux-headers-amd64 6.12.41-1 amd64 Header files for Linux amd64 configuration (meta-package)
ii linux-image-amd64 6.12.41-1 amd64 Linux for 64-bit PCs (meta-package)
こんな感じでmetaパッケージを入れておくと依存関係でimageと一緒に更新されるので自動ビルドでいけるはずです。 - すずきさん(2025/10/03 00:29)
なんと、メタパッケージ入れてなかったです。
$ dpkg -l | grep linux-headers
ii linux-headers-6.16.8+deb14-amd64 6.16.8-1 amd64 Header files for Linux 6.16.8+deb14-amd64
ii linux-headers-6.16.8+deb14-common 6.16.8-1 all Common header files for Linux 6.16.8+deb14
これで次からは楽になる〜。ありがとうございます。
この記事にコメントする
こんてんつ
wiki Linux JM Java API過去の日記
2002年 2003年 2004年 2005年 2006年 2007年 2008年 2009年 2010年 2011年 2012年 2013年 2014年 2015年 2016年 2017年 2018年 2019年 2020年 2021年 2022年 2023年 2024年 2025年 2026年 過去日記についてその他の情報
アクセス統計 サーバ一覧 サイトの情報